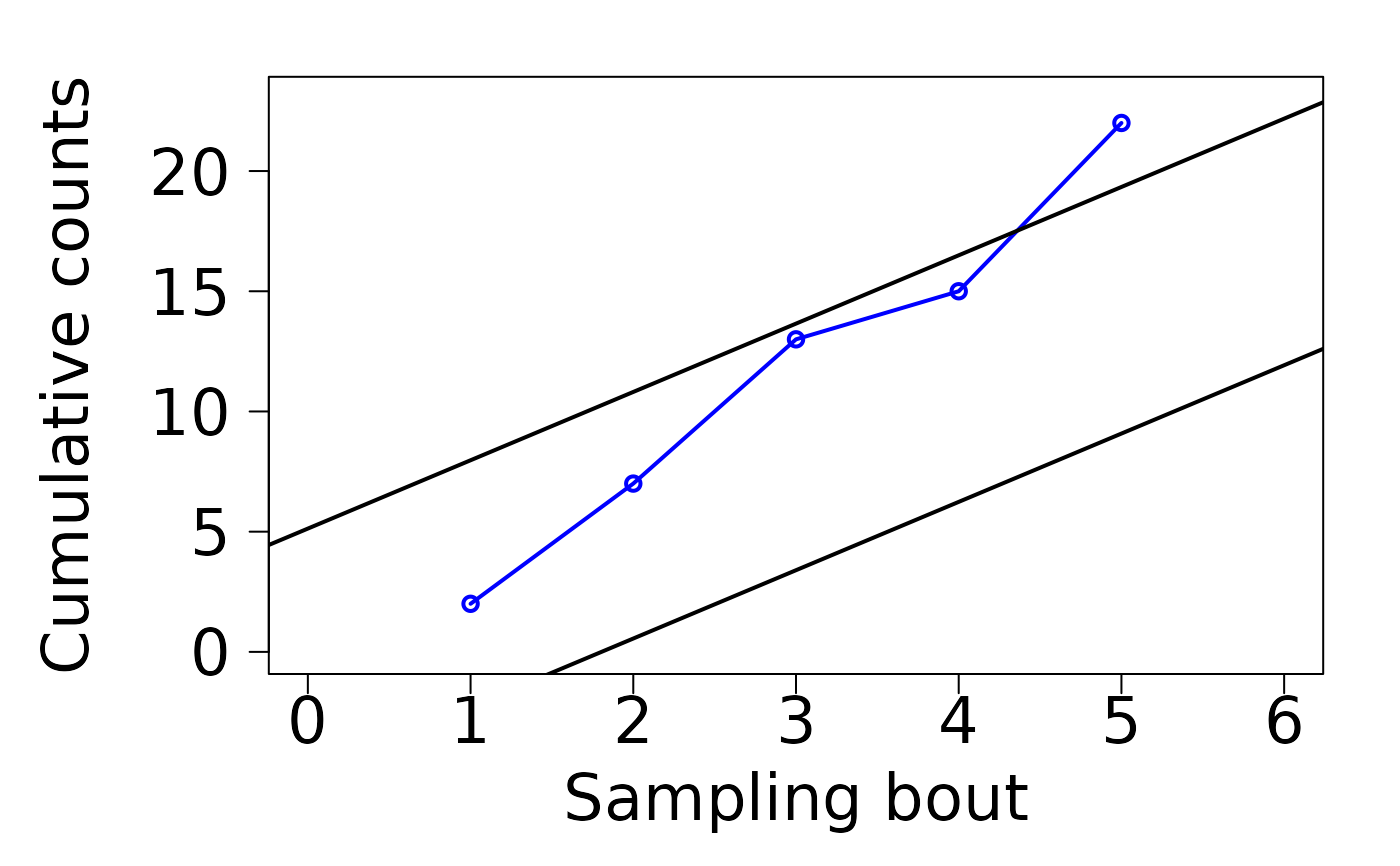
Draws a plot with the cumulative introduced counts contrasted with stop lines or stop lines when no data is provided
Source:R/SPRT-methods.R
plot-SPRT-missing-method.RdMethod for signature "SPRT" to display results or stop lines.
Usage
# S4 method for class 'SPRT,missing'
plot(x, y)
Arguments
- x
Created as a result of a call to
sprt.- y
Unused entry.
Value
When data is provided, a plot with cumulative counts contrasted with stop lines
from a "SPRT". When no data is provided, a plot with stop lines.
Examples
test00 <- sprt(mu0 = 2,
mu1 = 4,
density_func = "negative binomial",
overdispersion = 4.6,
alpha = 0.1,
beta = 0.1)
plot(test00) # returns chart with stop lines
 counts <- c(2, 5, 6, 2, 7)
test11 <- sprt(data = counts,
mu0 = 2,
mu1 = 4,
density_func = "negative binomial",
overdispersion = 4.6,
alpha = 0.1,
beta = 0.1)
plot(test11) # returns chart with data and stop lines
counts <- c(2, 5, 6, 2, 7)
test11 <- sprt(data = counts,
mu0 = 2,
mu1 = 4,
density_func = "negative binomial",
overdispersion = 4.6,
alpha = 0.1,
beta = 0.1)
plot(test11) # returns chart with data and stop lines
 ## End (Not run)